Here we go... absorb this like a sponge. If you are not somewhat familiar with Fibonnaci, this could quite honestly change the way you look at charts forever.
There are numerous Fibonacci tools available to traders. I've experimented with arcs, fans, spirals and several others. My personal opinion is that one is all you need. I consider it a big part of my strategy when trading. This breakdown is to show you the best and most accurate of all "Fib" tools.
The Mathematics and Genius
First and foremost...I greatly encourage you not to skip over the history of Fibonacci and the Golden Ratio. I think both the story and the genius behind the tool makes me that much more confident using it when I trade. Without going too deep into the math and history, I feel it necessary to at least highlight a few points. These points will also help you to understand other aspects of Fibonacci beyond retracements. Understand how the tool is effective before you use it.
The actual number sequence is naturally present within nature, and first appears within our history around 450 B.C. in Indian mathematics and Sanskrit texts. It was not until 1202 A.D. that it appeared outside of India in a book called "Liber Abaci" written by the Italian mathematician Leonardo of Pisa, who was known as "Fibonacci." An absolute friggin genius.
The Fibonacci number sequence is 0, 1, 1, 2, 3, 5, 8, 13, 21, 34, 55, 89, and so on. The sequence continues by adding the previous two numbers (1+1=2, 2+3=5), and is derived from the ratio .618 (61.8%), or the "Golden Ratio." This ratio can be found by dividing one Fibonacci number by the next in the sequence (34/55=0.618). When squares are put together matching these measurements, a diagram is formed that creates the Fibonacci spiral as shown below.
Spiral galaxies like the Milky Way, animal reproduction rates and genders, the family tree structure of honey bees, the spirals within seashells, the formation of hurricanes, growth rates of plants, petals on a flower, even the very DNA molecules that make up all living creatures are just a few examples of how the Fibonacci sequence (or Golden Ratio) is present within nature.
In 1509, Luca Pacioli wrote a book that referred to the number as the "Divine Proportion," which was illustrated by Leonardo da Vinci (I personally, would consider Da Vinci to be beyond the genius levels of intelligence). Da Vinci later called this sectio aurea or the "Golden Section."
The Golden Section was used to achieve beauty and balance in many paintings and sculptures within the Renaissance period, which is often referred to as the greatest art period in our history. Da Vinci himself used the Golden Section to define all of his proportions in his painting of The Last Supper, which includes the dimensions of the table, spacing between disciplines, and all proportions of the walls and backgrounds. The Golden ratio also appears in Da Vinci's Vitruvian Man (which is well known to have perfect proportions) as well as the Mona Lisa. Other artists who employed the Golden Section include Raphael, Rembrandt, Seurat, Salvador Dali, and Michelangelo with his painting of the Sistene Chapel and his sculpture, the statue of David.
Other names given to the Golden Ratio throughout history include "Extreme and Mean Ratio," "Medial Section," "Divine Section" (Latin: sectio divina), "Golden Proportion," "Golden Cut," and the "Golden Number."
Fibonacci tools use this special ratio that occurs within nature to forecast support and resistance levels. Might sound crazy, but I can attest from my own experience that it works... and works well.
Fibonacci Retracements
Alright... here we go. Applying the magic algorithm to trading stocks. By far, the most widely used Fibonacci tool is the Fibonacci Retracement. A retracement is simply a pullback or leg down. When price moves significantly, the beginning and the end of that move can be identified as the low and high, the tip of the lowest and highest candle wicks. Using the Fibonacci tool, you can measure the distance of that move and the tool will automatically place Fibonacci retracement levels on the chart. Lets go over one. We'll use PACB on the 15 min as our example.
To use the tool accurately, start the first point of the tool at the beginning (lowest point) of a leg up/spike/push. The final point (or click of the mouse) should be at the highest point of the move (if your charting software requires a third click, click back at the low again). Chances are that if the fibs are off, it isn't because they are wrong, its likely because you didn't measure accurately.
Same chart, but measuring the next leg up:
If finding the highs and lows is difficult for you, draw trend lines from low to high, and measure those moves. There are also many times I will manually type in the coordinates just to ensure that I have the true low and high of the move.
Price action should retrace (or pull back/decline) by a ratio of the Fibonacci sequence, generally a 23.6%, 38.2%, 50%, 61.8%, or 76.4% retracement. In my experience, this is true in all timeframes. Just another reason I never focus on just one. "See the product from every angle before you buy it."
Keep in mind, in this case you are measuring the move up, after a top is put in. It's a great tool at predicting a bounce. It can also be extremely useful when covering your short or entering a long trade.
You can go back over most any chart that you have recently traded and add fib lines to major moves. You will likely see what you could have done differently had you utilized this tool. Here are three different examples on one daily chart for SPY:
Fibonacci Support and Resistance
Notice on the chart below that after the top was put in on SPY, the price fell to the .382 retracement level to first find support, with the price bouncing back to the .236 which is now a broken support (turned resistance). The price then bounces off this resistance and turns downward, breaking support and continuing the fall to find a base at the .50 retracement level.
Once the base formed (in this case, at the .50) the price rallied to break support.
Above, I've highlighted the significant drops at the support break levels. These drops indicate heavy selling, most likely a result of longs selling, stops triggering, short entries, put options, or a number of other factors. Either way, it is evidence that these Fibonacci levels are respected throughout the market.
Entry/Exit
This is where things really get interesting. Using the Fibonacci retracement tool effectively can signal the best entries, and warn you of imminent pullbacks. Again, the following is valid for all timeframes:
Long
Entry - These points that provide long entry opportunities (or bounces) are the .382, .5, and the .618 levels. If you prefer to scale in, your first entry would potentially be the .382, with adds coming at .5 and the .618 should the price drop to that level.
If a safer trade is what you prefer, wait until the touch of the .618 and a break of the .5 resistance to the upside for a long entry signal. Set stop just below that level.
Exit - When holding a long position, the recent low is likely behind you. With the Fibonacci tool starting at that low, keep moving the ending point up as new highs come in. Remember, each Fib level is a support level. If scale out is your style, a break in the .236 would be your first sell order. The next would be the .382, followed by the .5, and a break in the .618 being your "all out."
For a safer play, close your long position at the first sign of a pullback. If the .236 level holds, consider adding to your winner. If it breaks to the downside, close your long position.
Short
Entry - Essentially the signals for shorts are the opposite of longs. Following a run or move up, a break in the .236 signals a reverse in momentum, and that price may be heading down.
For the scale trade, your first entry would be a break in the .236 support to the downside, with adds coming at the .382, .5, and each break that follows. For smart trade, short at break of .236 and cover if unable to break the .382 to the downside. Set stop just above .236 level, moving down above each level that as it breaks to the downside.
Exit - Cover signals are breaks in the resistance to the upside. For the scale trade, scale out with each break in resistance. For smart trade, cover all at first break to upside.
Fibonacci Extension Levels
Some software gives you a "Fibonacci line tool" while other software features both a retracements and extensions tool. The truth is, the extension tool is essentially useless. You can change the settings on the retracement tool, and add the extensions to the retracement tool to create a 2 in 1, as other software already have.
If a retracement is a leg down or pullback, then an extension is a leg up or push. If Fibonacci retracement lines measure the leg up, extensions therefore measure the leg down. Essentially you are measuring the size of a pullback and forecasting how high a potential bounce (or extension) may be. Do this by measuring backwards, high to low, as shown on the chart below:
Fibonacci extensions can therefore be used for profit taking or even counter trend entries.
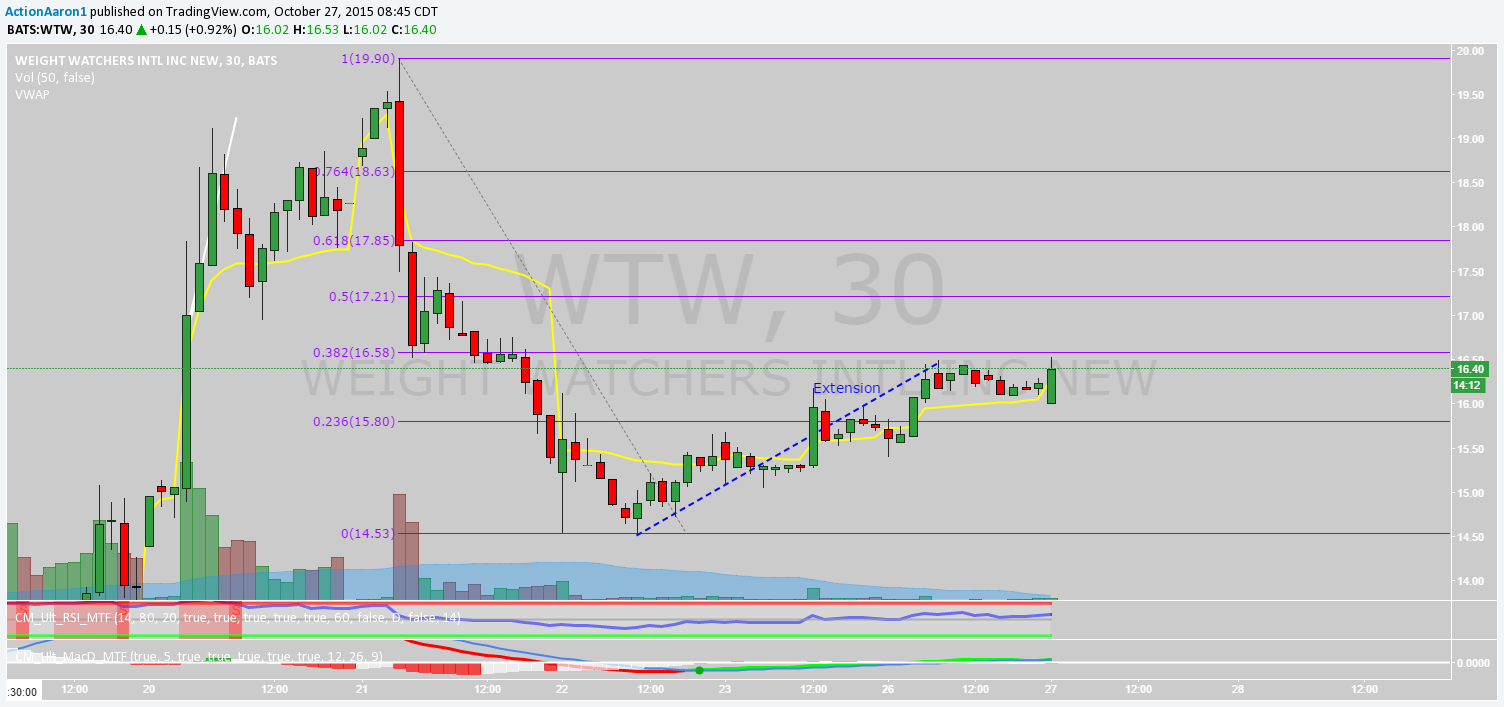
The Fibonacci line tool offers numerous lines that you can toggle off and on (on most software you can alter the levels manually to which ever you prefer.) The most common extension levels used by traders are the 138.2% and 161.8% levels, although there are many other extension levels used by different traders. The following is an example of extension levels being used in a downtrend on the back side of WTW's run up:
Below is a chart showing the extension levels of the Fibonacci tool applied to an uptrend.
Typically, the extension levels can be matched to the corresponding retracement levels to maximize profitability. As an example, if the price retraces to the .382 retracement level, then the related extension level would be the 1.382. The same principle would apply with a .5 or .618 retracement, as the related extension for both would be the 1.618 extension as shown above on NFLX hourly chart.
Conclusion
Now that you understand the basics of the tool, experiment with it. You'll be surprised at how useful it is, and how quickly it will become part of your arsenal. Remember, the most important factor involved would be the full measurement of the tool. Analyze high and low candlesticks to be sure your tool is set at the very low and very high of the move, to ensure accuracy with your retracement/extension lines.
If you found this post helpful or leaned anything you didn't already know, share with fellow traders, share online, follow me on twitter @tradermentality or subscribe for future post updates.
Labels: Technical Analysis